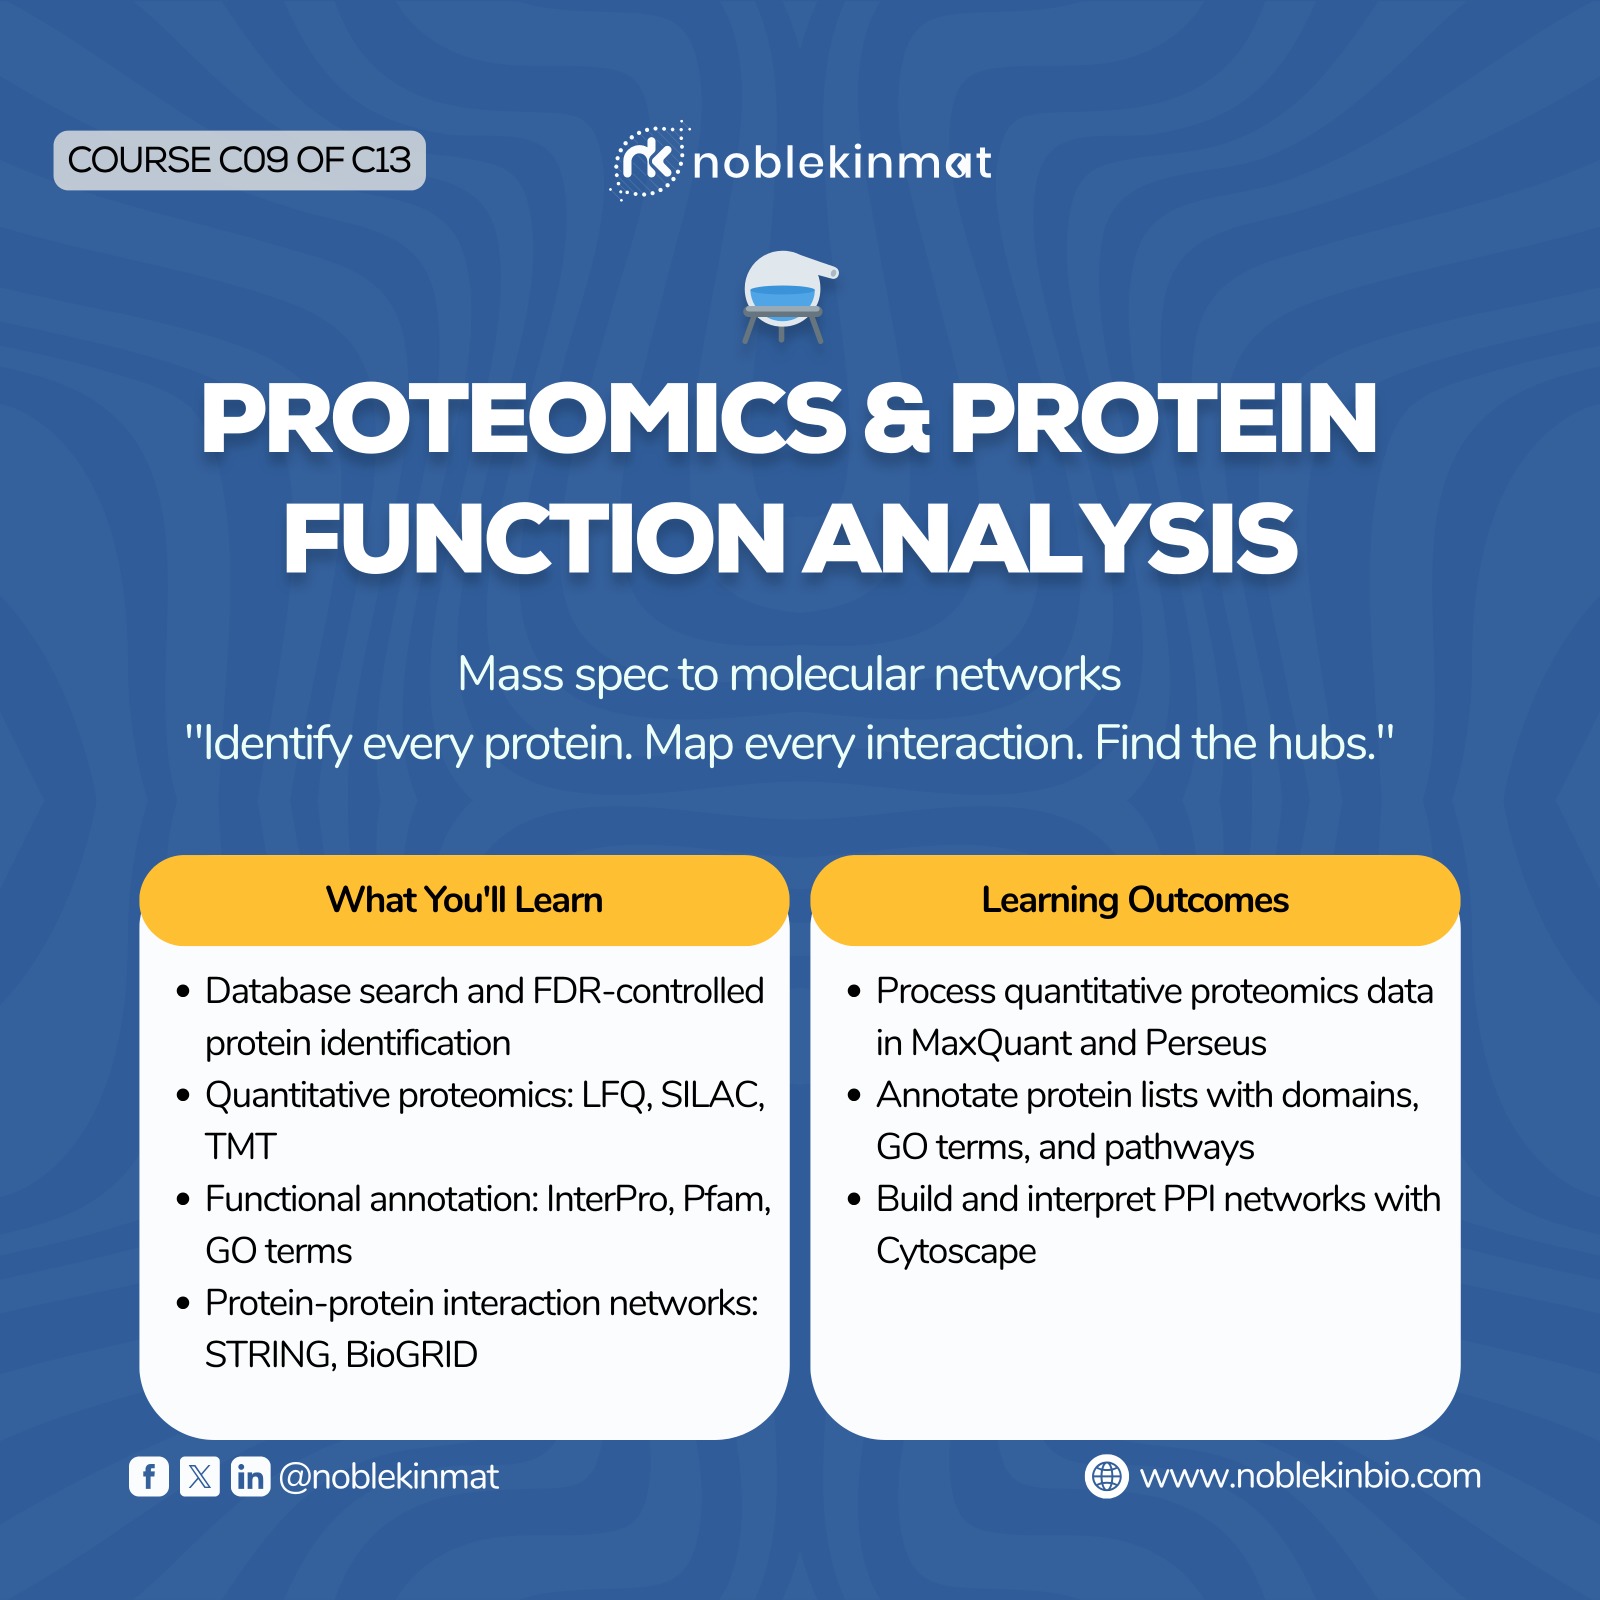
Proteomics & Protein Function Analysis
Course Overview
This course covers the full proteomics workflow from mass spectrometry data processing to functional annotation and protein interaction network analysis. Students gain practical skills in quantitative proteomics data analysis and the computational methods used to infer protein function at scale.
Learning Outcomes
1. Explain the principles of mass spectrometry-based proteomics and interpret MS data.
2. Process quantitative proteomics data using MaxQuant and Perseus.
3. Annotate proteins with functional domains using InterPro and Pfam.
4. Build and analyse protein-protein interaction networks using STRING and Cytoscape.
Curriculum Content
Week 1: Proteomics Methods & Data Processing
• Mass spectrometry basics: ionisation (ESI, MALDI), mass analyser (Orbitrap, TOF, ion trap), detector; tandem MS (MS/MS).
• Bottom-up proteomics workflow: protein extraction → trypsin digest → LC-MS/MS → database search → protein identification.
• Database search engines: Mascot, SEQUEST, MaxQuant — peptide-spectrum matching, FDR at PSM/peptide/protein level.
• Quantification methods: label-free (LFQ), SILAC, iTRAQ/TMT, data-independent acquisition (DIA/SWATH).
• MaxQuant and Perseus: LFQ intensity extraction, missing value imputation, statistical testing, volcano plots.
Week 2: Protein Function Prediction & Annotation
• InterPro: integrated protein family database (Pfam, PRINTS, ProSite, SMART, PANTHER, Gene3D, PIRSF).
• Pfam domain annotation: domain architecture diagrams; clan relationships; gathering thresholds.
• GO term annotation: molecular function, biological process, cellular component; evidence codes.
• DAVID and g:Profiler for functional enrichment of protein lists.
Week 3: Protein-Protein Interaction Networks
• PPI databases: STRING (experimental + predicted interactions), BioGRID (curated experimental), IntAct (curated), MINT.
• Network analysis metrics: degree centrality (hubs), betweenness centrality (bottlenecks), clustering coefficient, modularity.
• Cytoscape: network import, layout algorithms (force-directed, yFiles Organic), style mapping, community detection (MCODE, clusterMaker2).
• Network medicine: disease modules, drug targets in PPI networks, shortest-path distance to disease genes.
Hands-On Practicals
🔬 Hands-On Lab: STRING Network Analysis — Cancer Driver Genes
Step 1: Take the list of top 20 genes from your DESeq2 analysis (C08) as input.
Step 2: Submit the gene list to STRING (string-db.org) — select organism (Homo sapiens).
Step 3: Download the network in TSV format — import into Cytoscape.
Step 4: Apply MCODE algorithm to identify densely connected modules.
Step 5: Apply "Hub" style: node size proportional to degree, colour by betweenness centrality.
Step 6: Identify the top 3 hub genes — are they known cancer drivers? Search COSMIC.