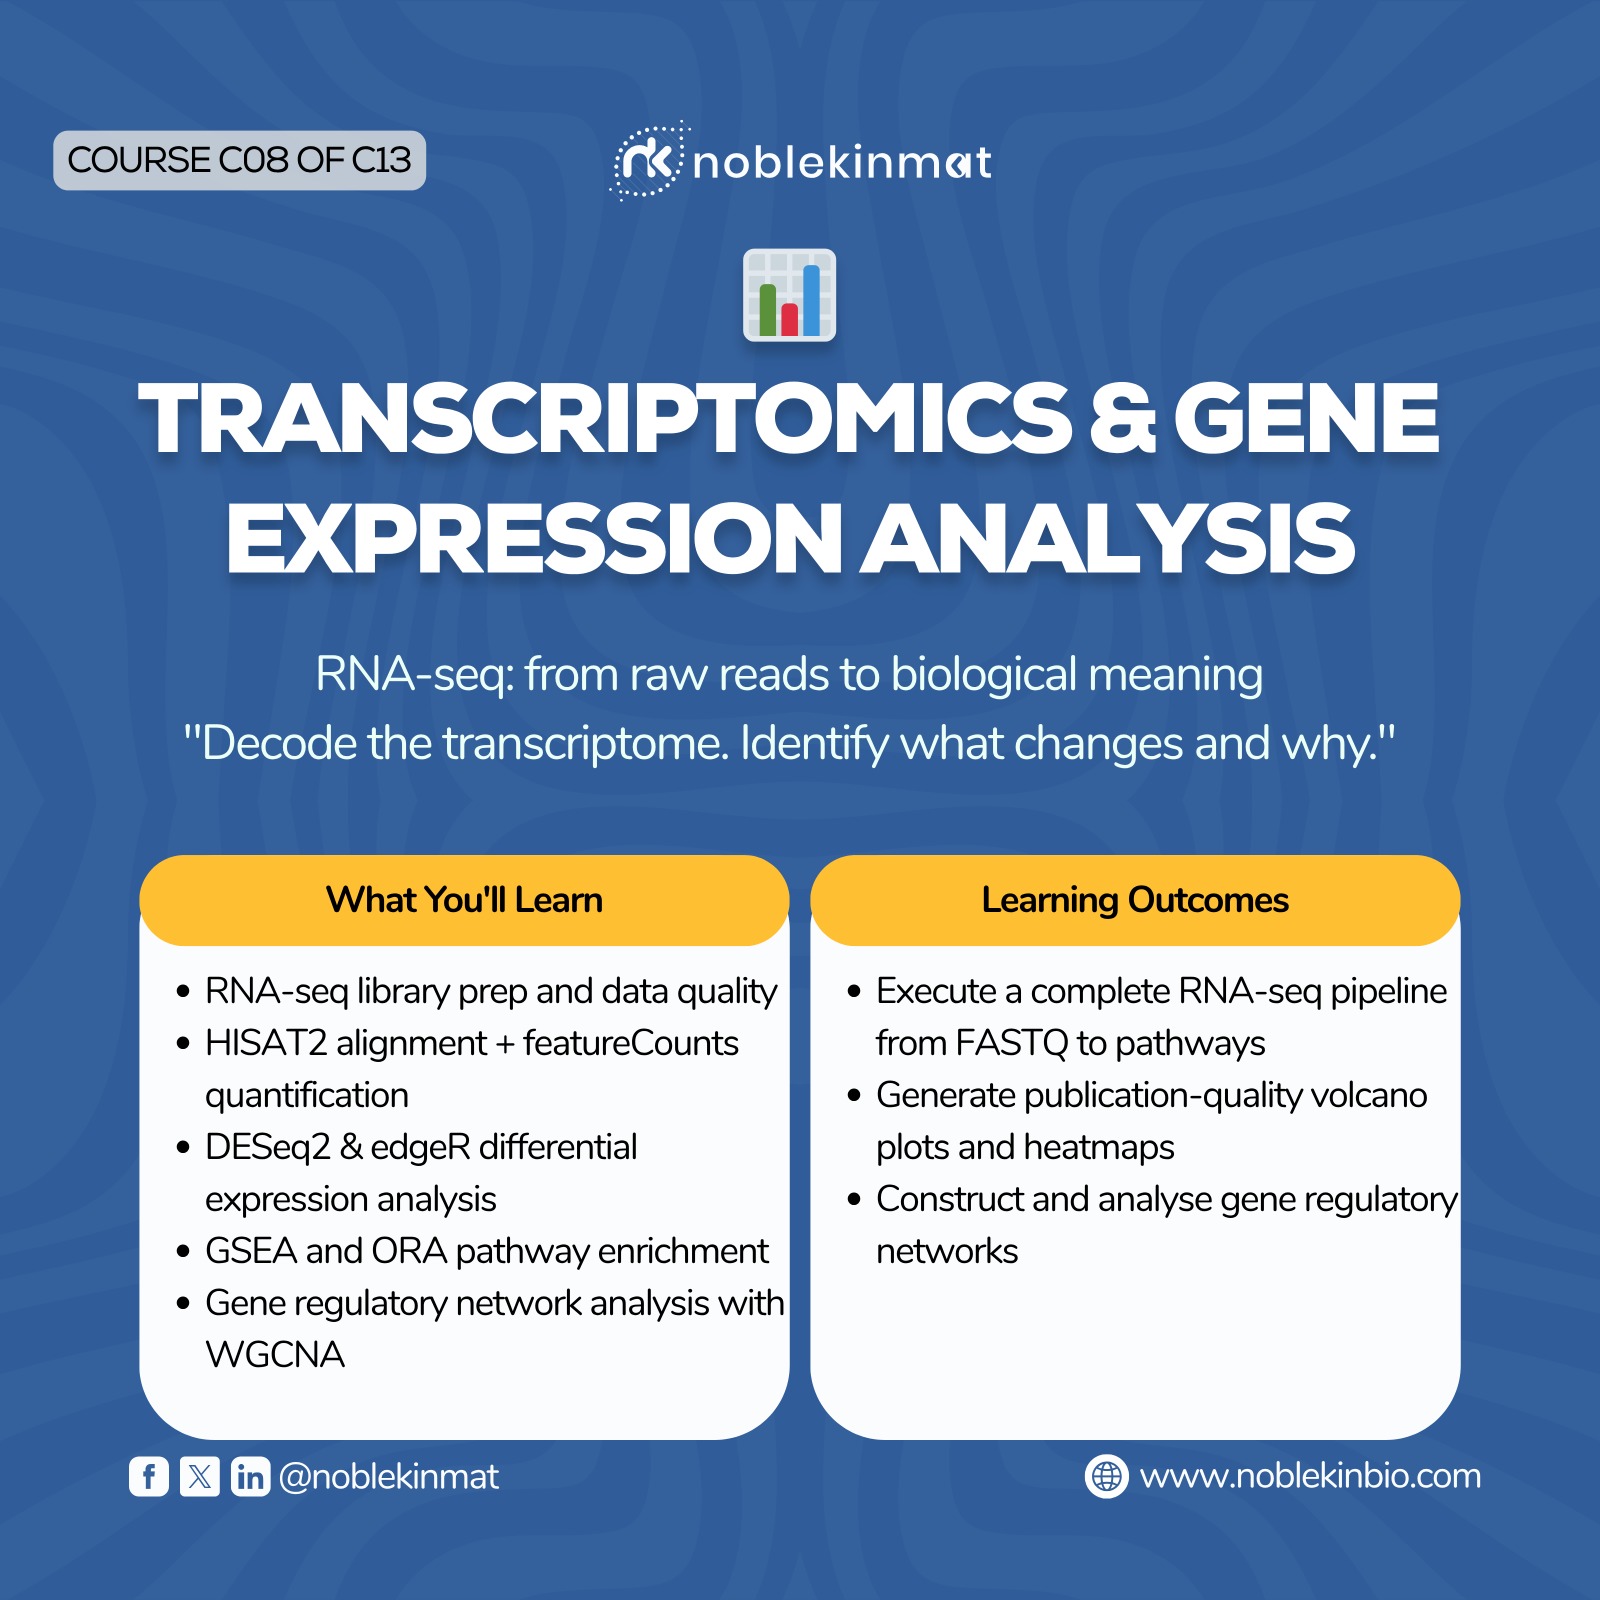
Transcriptomics & Gene Expression Analysis
Course Overview
This advanced course delivers complete mastery of RNA-seq analysis from raw sequencing data to biological pathway interpretation. Students learn the statistical underpinnings of differential expression analysis, pathway enrichment, and gene regulatory network construction. The course uses real published datasets and produces publication-quality figures.
Learning Outcomes
1. Execute a complete RNA-seq analysis pipeline: QC → alignment → counting → DEG analysis.
2. Perform and interpret differential gene expression analysis using DESeq2 and edgeR.
3. Run GSEA and ORA pathway enrichment analysis using clusterProfiler.
4. Construct and analyse gene regulatory networks with STRING and Cytoscape.
5. Produce publication-quality volcano plots, heatmaps, and pathway figures in R.
Curriculum Content
Week 1: RNA-seq Overview & Pipeline
• RNA-seq library preparation: poly-A selection vs. ribosomal depletion; stranded vs. unstranded libraries; UMIs for deduplication.
• HISAT2 alignment: splice-aware alignment, CIGAR strings for intron-spanning reads, alignment rate benchmarks.
• featureCounts: counting modes, multi-mapping reads, paired-end settings, GTF-based gene body assignment.
• Count matrix QC: library size normalisation, PCA for batch effects, sample distance heatmap.
Week 2: Differential Gene Expression Analysis
• Statistical model: negative binomial GLM (DESeq2); mean-variance relationship in RNA-seq counts; shrinkage estimators for dispersion.
• DESeq2 workflow: DESeqDataSetFromMatrix, design formula, DESeq(), results(), LFC shrinkage (lfcShrink).
• edgeR: DGEList, calcNormFactors (TMM), estimateDisp, glmQLFTest — comparison with DESeq2.
• Result interpretation: padj < 0.05, |log2FC| > 1 as cutoffs; MA plot, volcano plot, heatmap of top 50 DEGs.
Week 3: Pathway Analysis & Enrichment
• ORA (Over-Representation Analysis): hypergeometric test, background gene list importance, multiple testing correction.
• GSEA (Gene Set Enrichment Analysis): ranked gene list, enrichment score, NES, FDR q-value; leading edge genes.
• clusterProfiler in R: enrichGO, enrichKEGG, gseGO, gseKEGG, dotplot, barplot, enrichmentMap.
• Reactome and MSigDB databases: curated gene set collections for pathway analysis.
Week 4: Gene Regulatory Networks
• GRN concepts: transcription factor regulons, co-expression networks, hub genes, bottleneck genes.
• Co-expression analysis: WGCNA — soft thresholding, module detection (hierarchical clustering), module-trait correlation.
• PPI networks from DEGs: STRING database, Cytoscape for visualisation, network metrics (degree, betweenness, closeness centrality).
• GRN inference: ARACNE, GENIE3 for inferring regulatory edges from expression data.
Hands-On Practicals
# Complete DESeq2 workflow in R
library(DESeq2); library(tidyverse); library(EnhancedVolcano)
# Load count matrix and metadata
counts <- read.csv("count_matrix.csv", row.names=1)
coldata <- read.csv("sample_metadata.csv", row.names=1)
# Create DESeq2 object
dds <- DESeqDataSetFromMatrix(
countData = counts,
colData = coldata,
design = ~ condition # compare treated vs control
)
# Filter low counts and run DESeq2
dds <- dds[rowSums(counts(dds)) >= 10, ]
dds <- DESeq(dds)
# Extract and filter results
res <- results(dds, contrast=c("condition","treated","control"), alpha=0.05)
res <- lfcShrink(dds, coef=2, type="apeglm") # Shrink LFC for stability
# Publication-quality volcano plot
EnhancedVolcano(as.data.frame(res),
lab = rownames(res), x = "log2FoldChange", y = "pvalue",
pCutoff = 0.05, FCcutoff = 1.5,
title = "Treated vs Control — Differential Expression")