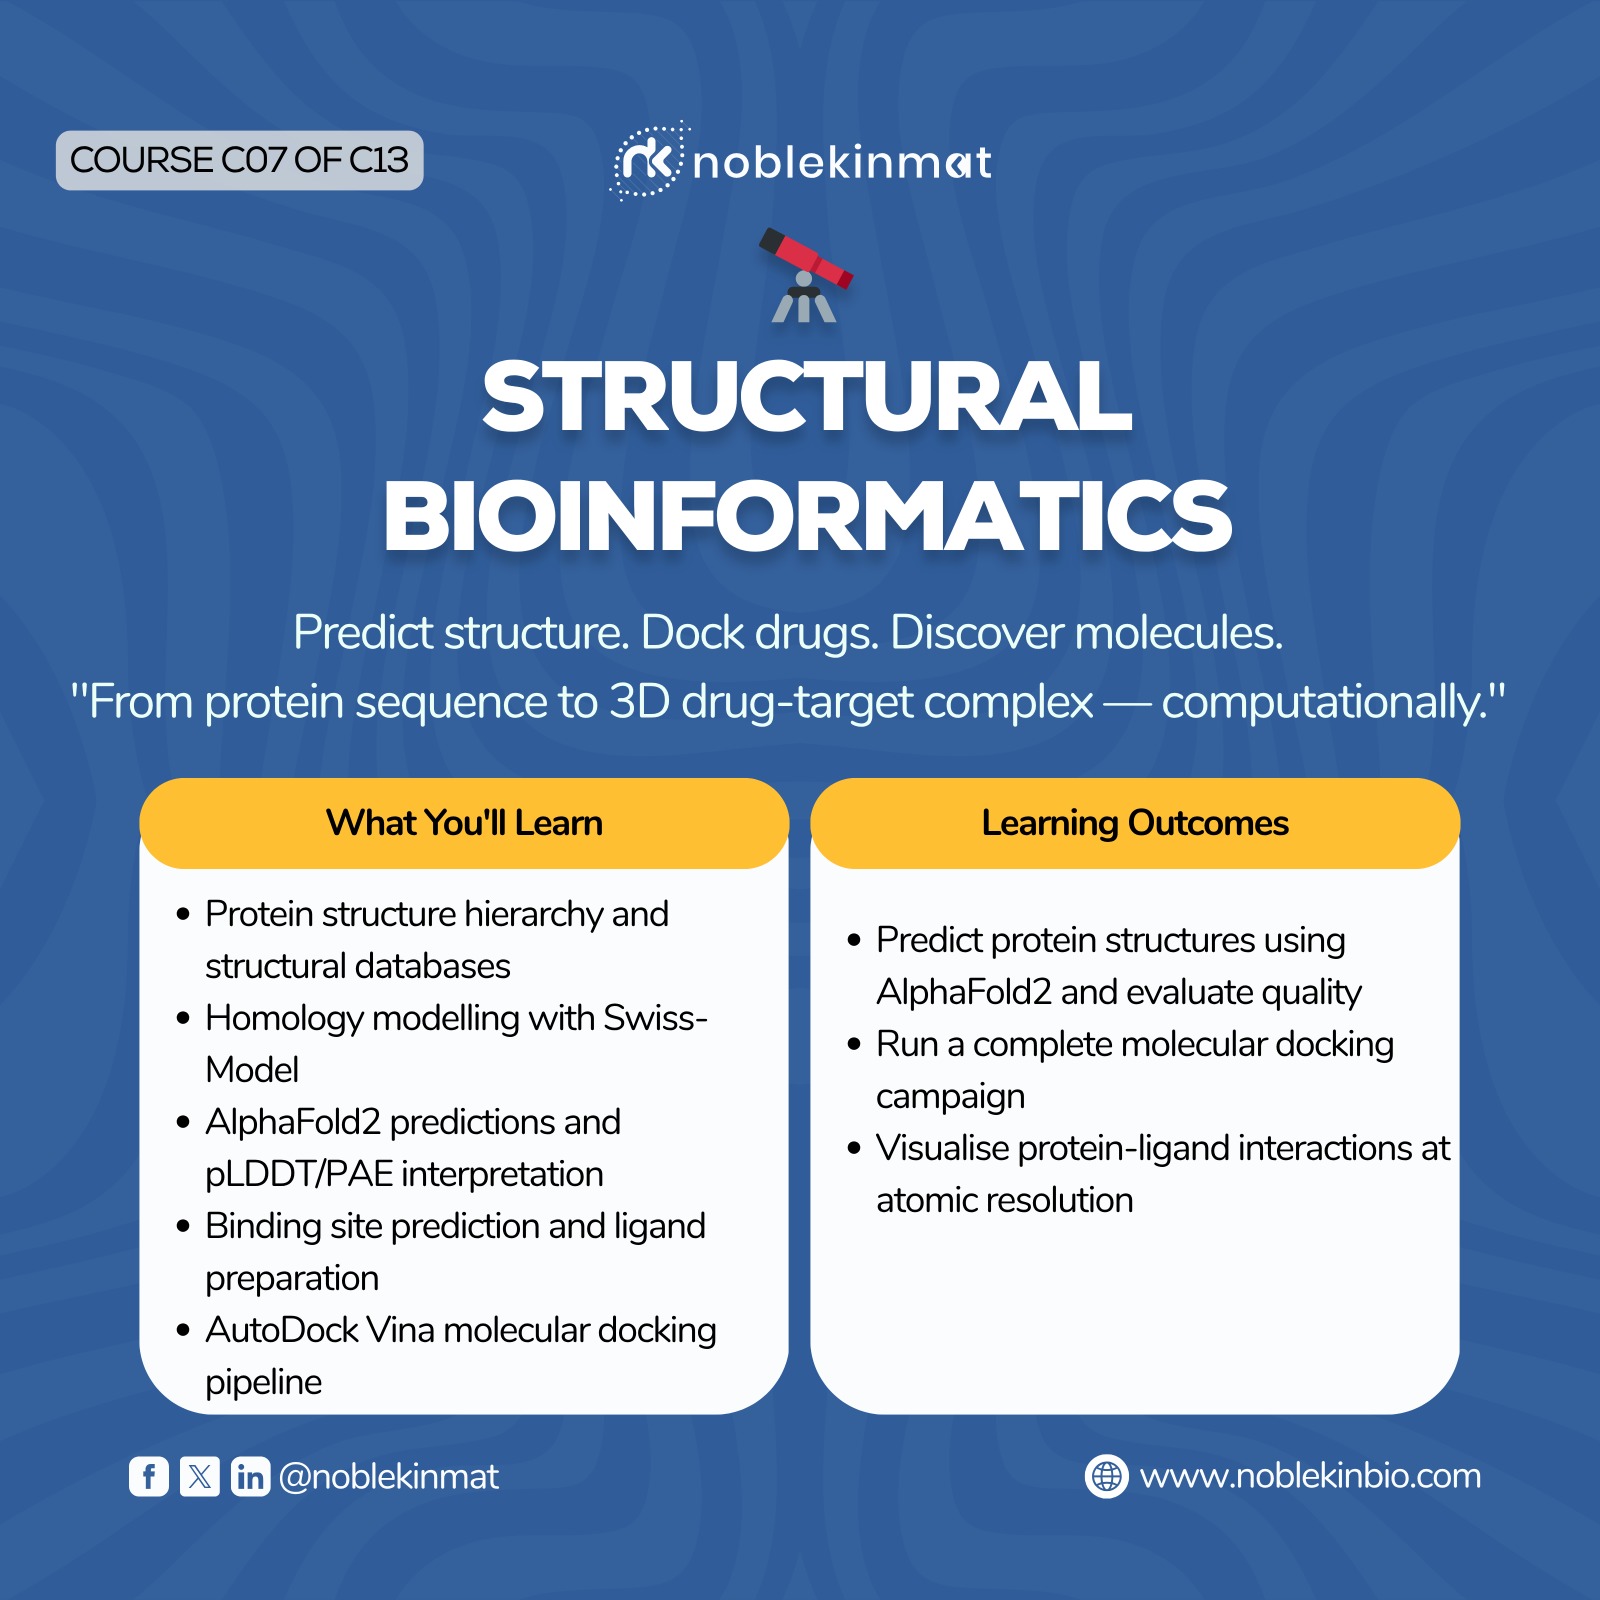
Structural Bioinformatics
Course Overview
Structural bioinformatics bridges sequence information with 3D spatial understanding of biological molecules. This course teaches students to predict, visualise, and analyse protein structures, and to model protein-drug interactions for drug discovery applications. Students gain proficiency with the key tools used in structural biology and computational chemistry research globally.
Learning Outcomes
1. Perform homology modelling using Swiss-Model and critically evaluate model quality.
2. Use AlphaFold2 predictions via ColabFold and interpret confidence metrics (pLDDT, PAE).
3. Prepare protein and ligand structures for molecular docking in AutoDock Vina.
4. Visualise and annotate protein structures at publication quality using PyMOL.
5. Analyse protein-ligand interaction fingerprints and interpret docking results.
Curriculum Content
Week 1: Protein Structure & Prediction Methods
• Structure levels: primary (sequence), secondary (α-helix, β-sheet, loops), tertiary (3D fold), quaternary (oligomers).
• Homology modelling: template search (HHpred), sequence alignment, model building (Modeller/Swiss-Model), loop modelling, side-chain packing.
• Model quality assessment: DOPE score, QMEAN, MolProbity Ramachandran plots, ProCheck, ERRAT.
• AlphaFold2: architecture overview (Evoformer, structure module), pLDDT score interpretation (>70=confident, >90=very confident), PAE plots for domain flexibility.
Week 2: PDB, CATH, SCOP, and Structural Analysis
• PDB entry navigation: experiment type, resolution, R-factor, asymmetric unit vs. biological assembly.
• CATH and SCOP: classification hierarchies (Class, Architecture, Topology, Homologous superfamily); using structure for function inference.
• Structural alignment: TM-align, Dali server; RMSD calculation; structural comparison without sequence similarity.
• Intrinsically disordered proteins: IUPred, PONDR — functional significance; disorder-to-order transitions.
Weeks 3–4: Protein-Ligand Interactions & Molecular Docking
• Binding site prediction: CASTp, FPocket, SiteMap — identifying druggable pockets.
• Ligand preparation: SMILES, SDF format; protonation state at physiological pH; 3D conformer generation (OpenBabel, RDKit).
• Molecular docking: rigid docking vs. flexible docking; AutoDock Vina scoring function (van der Waals, electrostatics, hydrogen bonds, hydrophobics); search algorithm.
• Docking validation: redocking (re-dock known ligand), RMSD from crystal pose; enrichment factor for virtual screening.
• Interaction analysis: PLIP (Protein-Ligand Interaction Profiler) — hydrogen bonds, hydrophobic contacts, pi-stacking; ProLIF for MD simulations.
Hands-On Practicals
🔬 Hands-On Lab: AlphaFold2 Structure Prediction via ColabFold
Step 1: Navigate to ColabFold (colabfold.mmseqs2.com) — run the AlphaFold2 notebook.
Step 2: Submit a protein of interest (start with human lysozyme P00698 if no specific interest).
Step 3: Interpret the pLDDT colour-coded structure: blue (>90), cyan (70–90), yellow (50–70), orange (<50).
Step 4: Download the PAE plot — identify flexible regions and domain boundaries.
Step 5: Compare your predicted structure to the experimental PDB entry (2LZH for lysozyme) — calculate RMSD.
Step 6: Run AlphaFold2-Multimer for a known protein complex of your choice.
🔬 Hands-On Lab: AutoDock Vina Virtual Screening
Step 1: Download Thymidine Kinase crystal structure bound to BVDU ligand from PDB (1KI6).
Step 2: Prepare receptor in PyMOL: remove water, add hydrogen atoms, save as PDBQT using ADFRsuite: prepare_receptor.py -r 1ki6_clean.pdb -o receptor.pdbqt
Step 3: Prepare ligand from SMILES: python -m rdkit to generate 3D, then prepare_ligand.py -l ligand.sdf -o ligand.pdbqt
Step 4: Define grid box around the active site (use centre of co-crystallised ligand as reference).
Step 5: Run AutoDock Vina: vina --receptor receptor.pdbqt --ligand ligand.pdbqt --config config.txt --exhaustiveness 16 --out results.pdbqt
Step 6: Analyse: which binding energy (kcal/mol) was obtained? Use PLIP to identify interaction types.